
I don’t think we’ve linked to Andy Robinson’s video talk at LUG Radio Live 2008. Enjoy!
I don’t think we’ve linked to Andy Robinson’s video talk at LUG Radio Live 2008. Enjoy!
Wow, what a week. We launched the Hardware Upgrade appeal last Thursday to raise £10,000. And just 2 days 15 hours and 20 minutes later in the small hours of Sunday morning we reached that target.

This all happened so quickly we were astonished and totally humbled by the generosity and goodwill towards the project. It happened so quickly in fact that we felt that a lot of people wouldn’t even have had an opportunity to donate, so we decided to keep the appeal open a bit longer.
So after exactly a week we are formally closing the appeal having raised £16,222. The donate site will still stay up but we’ll change the wording so that it’s for general fund raising and not focused on any particular need.
We have some very big thank yous to make. Firstly, we are enormously grateful to Google. The guys from the Google Open Source Programs Office really appreciate what we are doing and donated £5,000. Awesome.
Second we have to thank CloudMade. Steve and Nick are always the first people to dig deep and support the project, whether it’s tile hosting for cycle maps, organizing mapping parties or sponsoring the State of the Map conference. Once more they didn’t hesitate and donated £2,000. Thank you CloudMade.
Third, Richard Weait deserves mention. Richard does a lot for OpenStreetMap. Running mapping parties in North America, talking at countless Linux User Group meetings, coordinating mass geodata imports and, um, designing curling icons. On top of all this he donated $1,000 out of his own pocket. Props.
And last, but definitely not least, we need to thank every single other person who made a donation. Collectively you raised all the rest – in true crowd sourced style. Your roll of honour is here. Each and every single donation is really appreciated. Thank you guys.

We’ve raised enough for a new database server. It will probably be a better spec than we had planned or hoped for, so it should see us good for some time.
And with the remaining funds? Well I think everyone agrees that the wiki server could use some better hardware so we’ll be able to take care of that. Beyond that, if the community has any ideas then we’d really like to hear suggestions for what else needs a bit of a boost. Please tell us which other core services you think would benefit from a bit of help.
Check out Fedora Geo Spin – “Fedora Geo Spin is a collection of mapping tools that run on Fedora. This includes tools for map making, integration into OpenStreetMap, and components that can be run on a GPS enabled device.”

Our first set of ‘real’ servers was installed by me (SteveC), Nick Black and Nick Hill utilising the latest in safe server transport – Nick Hill’s overloaded Peugeot. Here they are being modelled:

Today we’re kicking off a funding drive to raise £10,000 to buy new API database servers for the upcoming new API and server software which we call “0.6” as it’s the 6th version. Specifically we’re after a 3U Rackmount server, 2x Quadcore, 24GB RAM, 10x SAS 15kRPM disks.
OpenStreetMaps exponential growth since day one has led to increasing demands on the hardware and software clockwork which make it tick day and night, and this funding drive will put us in a fantastic position to cross the next hurdles of mapping the planet. We have incredibly dedicated volunteer sysadmins and coders building OSM today, so let’s give them the best tools for the job to continue building the most detailed map of the planet.
So please consider heading over to donate.openstreetmap.org and chip in some cash for the cause. We’ll keep you up to date with the process of buying, setting up and installing the new hardware.
Donate today!
You can follow along the OSM action on Twitter. Check it out by following OpenStreetMap and SteveC
I’ve had a few inquiries into OSM in Africa recently, put together this brief survey of the action there. If I missed anything, post in the comments.
OpenStreetMap is growing rapidly across all of Africa. Mapping is spreading through local mappers, mappers on vacation, foreign nationals, and remote mapping using satellite imagery. A recent comparison judged that OSM had the most comprehensive coverage of Africa among web mapping services, especially in cities.
Wiki Projects
There are active African wiki projects in Algeria, Burkina Faso, Burundi, Cameroon, Congo-Kinshasa, Egypt, Ethiopia, Ghana, Kenya, Morocco, Nigeria, Rwanda, Senegal, South Africa, Sudan, Tanzania, Tunisia .. and other places no doubt.
Particularly interesting is a project to map the entire Nile.
UN
Bo Robert Pederson of UNICEF has been informally mapping Accra and Nairobi to comprehensive levels, and will be investigating bringing OSM more directly into UNICEF’s activities. There’s strong interest in East Africa in OSM as a component of the East Africa Spatial Data infrastructure.
In cooperation with the UNJLC, Neil Penman and other volunteers from IBM importing UN data sets for Southern Sudan into OSM. We continue to explore opportunies for collaboration there.
Conferences and Mapping Parties
In September 2008, the FOSS4G conference was held in Cape Town. Open Geographic Data and OpenStreetMap emerged
as main themes of the conference. Very successful mapping parties were held in conjunction, including mapping in townships.
Local mappers in Cape Town recently negotiated the release of all street data held by the Cape Town metropolitan region,
to supplement the already stellar OSM coverage there. This link is a quick rendering of the newly freed data.
In July 2008, Wikimania (the Wikipedia conference) was held at the Library of Alexandria in Egypt. OSM was presented to great reception. A mapping party was held in Cairo, and over the last six months Egypt’s maps have grown extremely
rapidly.
2009
Already a strong start to 2009, with new initiatives to promote and use OpenStreetMap in Africa.
DC Based technology consultants Development Seed have active humanitarian mapping projects using OSM in Zimbabwe, Somalia, and the DRC; And they are seeking interns to help with the effort.
The OpenStreetMap Foundation will be distributing donated GPS units to mappers in developing countries.
Not yet formally announced, the codenamed “Mappers Without Borders” project will be providing OSM mapping assistance to humanitarian response and development projects, particularly in Africa. (As a still informal entity, we’ve recently been active in mapping the Gaza Strip.)
I’ve put together a little screencast on how to do the simpler form of addressing with potlatch. That is, how do you add house numbers and ranges in to OSM? There are some more formal ways of doing it but this should get you started.
We are delighted to announce that OSM has received a donation of 68 GPS units. Thanks go to James Doughty of Diass who very kindly donated them.
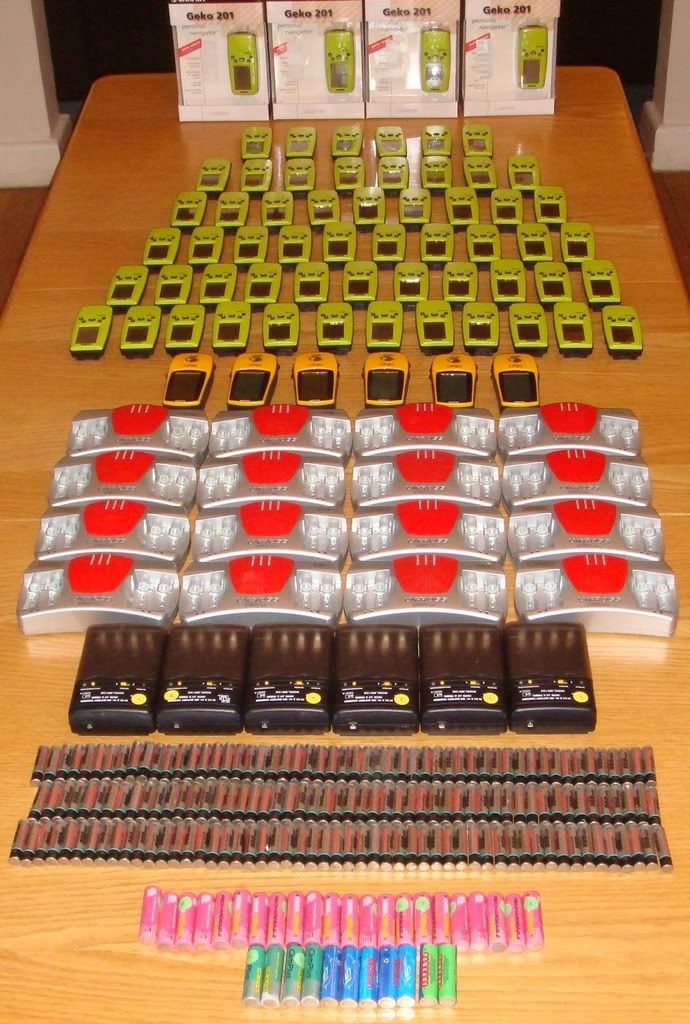
In addition to the 68 GPS units, which are mainly Garmin Geko 201s, James also provided an assortment of batteries, battery chargers and cables. There’s a full inventory of everything we received here (google spreadsheet).
So now we have to decide how to make the best use of them. Obvious uses are mapping parties and the GPStogo scheme, but if anyone has other good ideas for ways that we could use them then we’d really like to hear about it.
Check out this podcast talk with User:Steve and Andy Allean, we discuss the opencyclemap and API 0.6.
Also check out previous podcasts and subscribe to this RSS feed in iTunes or whatever.
About 3,000 years ago when I started freethepostcode, little did I know that soon everyone would be using giPhones… and that the McKerrellmeister would write an app for your iPhone 3G which lets you upload postcodes using the iPhone built-in GPS. Check it out.
