Category Archives: Geodata

OSM first to honour plate tectonics

Published: 1st April 2017 😋

OpenStreetMap is set to be the first world-wide geo database that actively tracks plate tectonics. The OSM Foundation board has given the green light for tectonic correction to be applied to the OSM database, starting today.

You won’t notice it immediately – the changes are minuscule enough to be laughed at by some. But the effects are undeniable, and our always dedicated sysadmin team has been hard at work to devise queries against our database that correct for plate tectonics.

As you know, the earth’s surface is made of tectonic plates that drift apart slightly over time. With OSM using the WGS84 coordinate reference system (as opposed to e.g. ETRS89 which also has latitudes and longitudes but defines them relative to fixed markers), our coordinates get “out of sync” with time.

Plate motion based on Global Positioning System (GPS) satellite data from NASA JPL. The vectors show direction and magnitude of motion. (Wikimedia Commons)

This movement can amount to up to 10 centimetres per year. Luckily, models exist that tell us just how much the earth is moving at any given location. And of course our data model provides us not only with the latitude and longitude of a point, but also with the time when it was entered. Assuming the data was correct at the time of entering OpenStreetMap, we can compute exactly how much that particular point has moved in the time since it was entered, and we can update the coordinates accordingly. (This is, of course, just half of the story – where aerial imagery has been used to trace data, we rely on correct source tagging to automatically determine the date when the images were taken, to compute the applicable tectonic correction.)

A point that was entered just yesterday won’t move at all; a point entered at the same location 5 years ago may have to be moved by up to 0.5 metres.

In order not to burden our database with needless new version numbers for nearly all node objects, we’ve chosen to simply update the coordinates for all objects in-place; this means that the tectonic correction happens seamlessly, without leaving traces in the object history.

The first corrections will be applied today, and we’ll revisit the issue on the same day in the coming years.

If this all sounds like techno-babble to you – just take away one thing: OSM does everything in their power to achieve maximum data quality and accuracy.

The Cake Test

During the course of history, we have used several types of tests to tell if something is what it seems to be, or to check if it is up to expectations.

Now we use industrial stress tests, quality assurance checklists and software metrics. We put dummies inside of cars and crash them into concrete walls at full speed, to check if the dummy gets out in one piece or not; then we decide whether the car is safe enough. Centuries ago, the church used the trial by water ordeal: tie a rock to a woman’s leg and throw her into a lake; if she drowns, she’s not a witch; if she comes back to the surface, she is a witch and has to die by burning.

Free software also has tests, which are scientifically more accurate than the trial by water, as one has to tell apart free-as-in-free-beer licenses from free-as-in-free-speech ones. During the development of free software licenses (such as the GPL) in the 90s, there are some tests which are well-known amongst free software advocates: the “desert island test”, the “dissident test” and the “tentacles of evil test”. These test were an integral part of the Debian Free Software Guidelines (or DFSG for short). The DFSG are just a definition, and are not easy to explain to a layman: it’s better to check against some use cases.

For example, the “desert island test” assumes a castaway in a desert island with a solar-powered laptop, and some software in it. For this software to be free, the castaway has to not be legally forced to distribute any changes made to that software, as he just can’t. Technically, this test checks that the license asks for source code redistribution only when the binaries are distributed. This tests makes it easier to understand whether a license complies with the DFSG, rather than checking against the DFSG themselves.

And what about geographical information? Is there any test that lets us know whether or not the information from National Mapping Agencies (NMAs) or Spatial Data Infrastructures (SDIs) is really available under conditions that allow the citizenship to make the most out of them?

In order to know if a given set of geographical information can be considered free (as in free speech) or open or “libre”, it can be checked against the Open Knowledge Definition (OKF), just as free software can be checked against the DFSG. However, the OKF can be a bit dense for laymen.

There is no easy test to know if a set of geodata is free/open/libre or not.

Until now.

I hereby propose the Cake Test.

SotM09 cakes

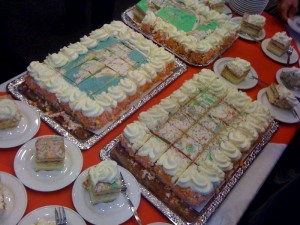
What is the Cake Test? Easy: A set of geodata, or a map, is libre only if somebody can give you a cake with that map on top, as a present.

The Cake Test

Cakes are empirical proof that most the data in most SDIs cannot be used freely, because of the licensing terms of the SDIs. And they are an empirical proof that attendants to the latest spanish SDI conference could taste themselves.

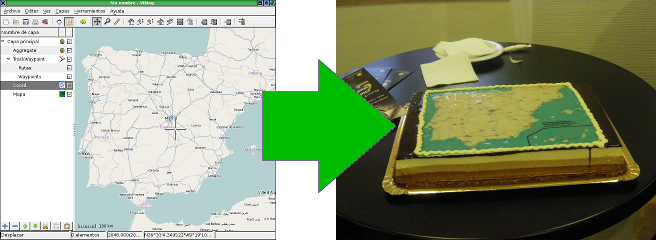
Even if maps, or geodata, are published in a web site for free (at no cost), it doesn’t mean that a cake can be made with them. Some examples of technical or legal obstacles for the “cakefication” of geodata are:

  • Not being able to download the geodata to a computer.
  • Not being able to copy the geodata to a different medium, or not being able to redistribute it. In order to make the cake, a bakery needs a CD with the images, or an e-mail with them.
  • Not being able to use the maps for profit (AKA “commercial use”), even if the person giving the cake away is not making any profit (AKA “indirect commercial use”). The one giving the cake does not make money, but the bakery does.
  • The obligation to sign a license (or such) for commercial use. Do you really expect people to go to a bakery and say “hey, I’d like a cake, but you need to sign this commercial-use-of-geodata-license thing first”?
  • The obligation to notify any usage of the geodata prior to using it. If we have to tell we’re making a cake, it wouldn’t be a surprise, would it?

A set of geodata must comply with lots of conditions in order to bake a cake with it, and may seem complex when applied to a geodata license (and the Cake Test is just a neccesary condition, not a sufficient one), but the goal of the Cake Test is very simple:

If a layman can’t decide whether he can or can’t decive if he is able to give away a cake as a present, or plainly isn’t able to, then the geodata cannot be used freely, is not free, and is not libre.

On the other hand, if some day someone gives a NMA or SDI a cake as a present, then that NMA or SDI is on the right track for information reuse. And the day that happens, they’ll probably throw a party, as they’d already have the cake.


The Cake Test also illustrates the concept of long tail.

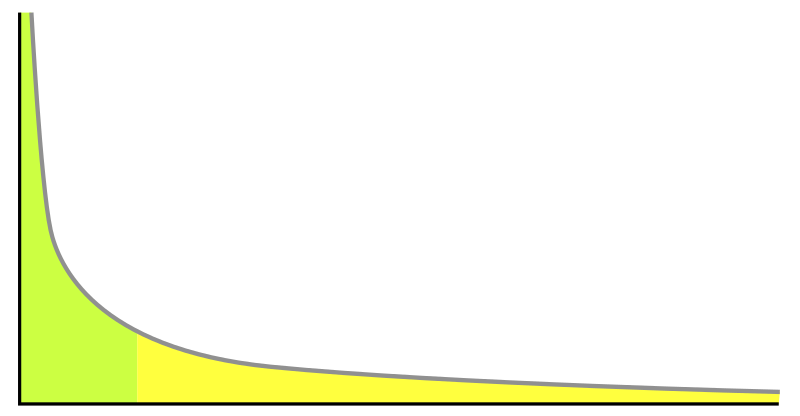
Usually SDIs and geoportals are built in order to the big geodata consumers to generate more profit, or lower their costs. This is the green section of the graph: quite few data consumers, but consuming a lot of data involving a lot of money. They are government agencies, and big corporations and projects. On the other end of the graph, in the yellow section, would be them cakes.

Obviously, cartography applied on top of pastry products is just a marginal contribution to a country’s Gross Income. But it’s not a null contribution and, most probably, no one thought about it before.

The long tail is full of cakes and other marvellous things that haven’t been invented yet. How many new uses for geodata are there to be discovered? How long is cartography’s long tail? The only certain thing is that, in order to know that, free use of geodata has to be encouraged.

(This is a translation of an article originally in Spanish, available here)

Open Data from Toronto

Mark Kuznicki hosted the Toronto Open Data Lab at the Toronto Innovations Showcase this week.  This was the official launch of dataTO.org, Toronto.ca/open and the release of several open data sets.

I was pleased to meet so many folks working at the city of Toronto and at the province of Ontario who showed so much interest in Open Data.  There were many great conversations going on, from the exhibition floor at the city hall rotunda to the mixer at a local pub later.  All of these are great signs of a new open-awareness at the city and I see it as overwhelmingly positive.

Being new to the world of Open, the city wanted some feedback regarding for what applications people would use this newly available data.  As Toronto Transit Commission data, addressing data and road centrelines were all released I thought immediately of the travel planner for London from mySociety.

I had that chance to talk to many folks about OpenStreetMap through the course of the day and I was pleased to share my enthusiasm for a travel planner like this using the Toronto data.

Travel planner using Toronto Open Data

The data we have now is imperfect but rather than critiquing the quality of the dance steps of this bear, let’s marvel that Toronto released open data at all.  Most of the data sets grew up in separate silos in Toronto departments.  The folks at the city are as new to these data sets from other departments as we are.  They’ll get used to working with each other in an open environment and that will move them to more of the open tools, standards and practices that we take for granted.  I’m sure we’ll see a bug tracker soon.  We’ll see increased use of open formats rather than proprietary lowest-common-denominators.

Bravo, Mayor Miller, for recognizing the benefits of Open.  Bravo, Mark Surman for challenging Toronto to become a city that thinks like the web,  This is an important step along that way.

Toronto City Hall Photo is licensed cc-by-nc-sa by Vlastula on Flickr

London Travel time map is licensed cc-by-sa by Tom Carden.

The Crowd Sourced Approach Gathers More Supporters

The Geographers, GIS buffs and spatial analysts at UCL have always been big supporters of OpenStreetMap.  Over the last few years more and more of their attention has been turning to the study of crowd sourcing as a way of creating geographic information.  One great example of applying academic research to OSM is Muki Haklay’s 2008 OSM Quality Evaluation work, in which Muki compared OSM data to data sets produced by the UK Ordnance Survey (OS) – the UK Government body charged with mapping the UK.  The OS has a fierce reputation for for producing some of the most accurate and most detailed maps in the world, so its impressive to hear that: “The positional accuracy [of OSM] is about 6 metres, which is expected for the data collection methods that are used in OSM. The comparison of motorways shows about 80% overlap between OSM and OS…”.  Of course OSM moves quickly – there are now more than 100,000 OSMers around the world compared with 35,000 this time last year – so when I spoke to Muki earlier this year I was excited to hear that there is more OSM data analysis on the way.  Watch this space and in the meantime, take a look at this recent presentation.

A team of UCL Geographers are taking their interests in crowd sourcing on the road, speaking at the American Association of Geographers annual meeting in Las Vegas next week (22nd – 27th March).  Papers include: “Neogeography: Crowdsourcing and Mapping for Masses” – something that should be of interest to any OSMers in the area.  Another interesting looking title comes from TeleAtlas Chief Scientist Don Cooke talking about “Neogeography and Crowdsourcing: the View from a Walled Garden“.  I got the opportunity to talk to Don after giving a presentation about OSM and crowdsourcing at last year’s Where2.0 conference.  He was a big fan of OSM and the crowd sourcing model.  One thing’s for sure – the often distainfuly labelled “paeleo” generation are not going to roll over and die.  Guys like Don Cooke or the UCL geographers are veterans of an industry that has created vast data sets, empowered millions of people to make better decisions, as well as creating companies with multi-billion dollar price tags.

How will OpenStreetMap react when the “walled garden” approach to crowd sourcing puts the power to edit and create maps in the hands of everyone with a mobile phone or a sat-nav?  To make sure that the open approach to crowd sourcing keeps on producing data sets that can be favourably compared with those of the walled gardens we need to keep one step ahead.  Learn from the acheivements and mistakes of companies like Tom-Tom, who are embracing crowd sourcing.  Openess alone isn’t going to build a free world map.  We need to expand the reach of OpenStreetMap – attract 900,000 more mappers in more places of the world and help them produce better maps.

OSM Super-Strength Export

One of OpenStreetMap’s greatest advantages is that we don’t just give you a beautiful draggable map – we give you the data, so you can do what you like with it. Well, this weekend, that just got a whole lot easier.

OpenStreetMap now has an ‘Export’ tab, joining ‘View’ and ‘Edit’ at the top of the screen. It gives you an instant way to get the map data in a format you want.

Want a static map for your blog, without having to spend hours fiddling with JavaScript? No problem – just export in PNG or JPEG. Want a map for a book? PDF or SVG are the perfect formats – fully vectorised, so they look smooth on high-resolution printers at any scale, and are easy to restyle or edit. Want to play with the raw data? Get it in our easy-to-parse OpenStreetMap XML format. Here’s an example of a simple PNG streetmap generated in just two clicks.

And this is just the start – our mailing lists are already buzzing with possibilities for new formats, such as Adobe Illustrator for cartographers, or shapefiles for GIS professionals.

With this new feature, the difference between OpenStreetMap and the “corporate” mapping sites becomes a whole load clearer. Other mapping sites’ agreements with their data providers (such as Navteq, TeleAtlas or national mapping agencies) simply wouldn’t allow them to give the data out like this. With OSM, we actively encourage it!

The work behind this was done by Tom Hughes, winning OSM’s coveted Lolcat of Awesomeness developer award for the fifth time.

State of the Map 2008 site and cfp

SOTM
The State of the Map 2008 international OpenStreetMap conference website and blog is now live and the call for participation/papers has gone out. Speaker slots are limited and like last year are bound to fill up quickly, so send us your abstracts!
The conference is being held at the Kilmurry Lodge Hotel in Limerick, Republic of Ireland on 12th and 13th July 2008.