Monthly Archives: November 2011

Thanks to the 2012 OpenStreetMap Foundation Board. This is going to be the year.

Last weekend in Seattle, the OSM Foundation Board met “face-to-face”. We get together because no matter how much you try otherwise, there’s way more done in person in a couple intensive days. It cost about 4 or 5k USD this time, and it’s worth the cost. But, I think we’ve always done a terrible job explaining what happens at the Board meetings, and a middling job following up, and those two things are totally related.

I want this meeting to be different. It must be different. This is my fifth year on the Board and final year on the Board (I was elected again this year, but will stand down at the next AGM), and to me, and the entire Board, this is a crucial year for OSM. The face-to-face was the most productive yet, and the most difficult yet. I’m very satisfied. In year’s past, the minutes get published, and various announcements go out through working groups, and that will happen.  But it’s insufficient, maybe distilling too far the atmosphere and the messiness of these get togethers.

The Stage

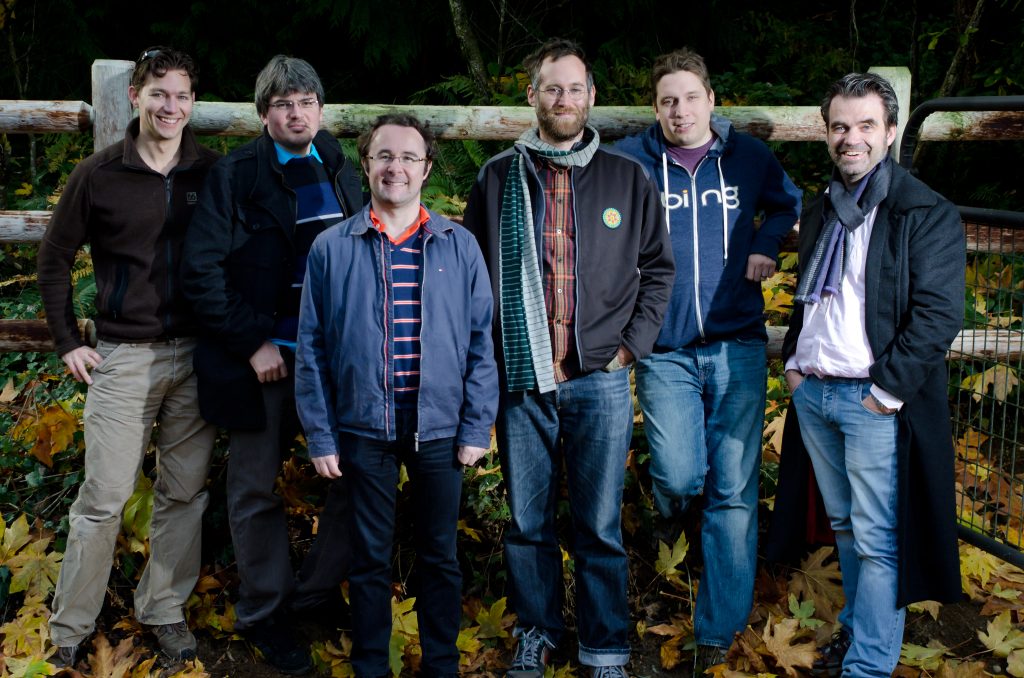
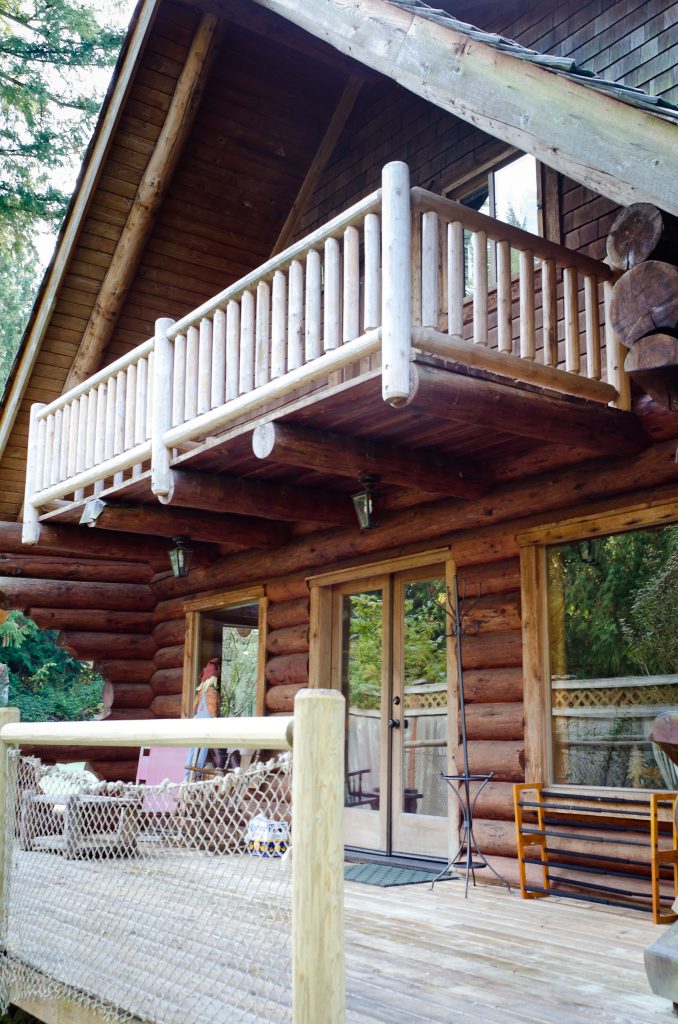
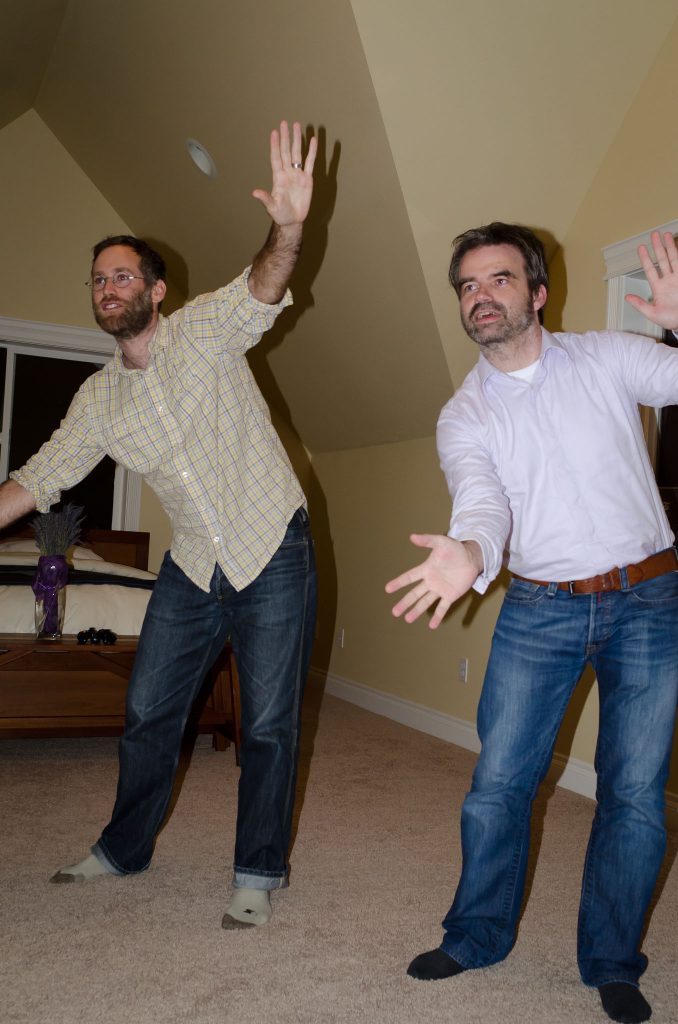
Steve is based in Redmond, and expecting a child any day, so he offered to host and avoid travel. I wasn’t far, relatively, in Chicago. The rest of the Board (excepting RichardF who couldn’t make it) flew in from Europe. I found a cabin near a lake on airbnb, quiet, cosy, and cheap. Henk hired a car, and drove everyone around. We had a meetup Friday night, made some burritos and played Kinect at Steve and Hurricane’s place (and tried to forget we watched Crank 2), and enjoyed the Seattle sunshine (no joke). Sunday Hurricane gave us horse riding lessons!

A regular vacation! Except for the part where we spent 18 hours of our weekend discussing/arguing about OSM in windowless meeting rooms at Microsoft (which we very much appreciate btw!). And the rest of the weekend continuing to talk about it, or even dream about it. Being on the Board is a sacrifice of time, because we all feel deeply responsible to the project and our position.

Presentations

The Board meeting proper started with presentations by Steve and Oliver. Steve hit many of the same themes from his SOTM and SOTM-EU talks, except he left out all the stuff about how awesome OSM is doing. We looked and discussed several graphs of recent statistics. OSM’s growth to date has been beyond imagination, but there’s no shortage of projects that changed the world and then met reality, hard. Looking at some of these, the factors in decline included insular community, lack of direction, and no innovation. That’s what we have to avoid.

Oliver made the point that “We are the Board! Shape the project!”. The Board, and the Foundation, needs to be a functional team, with clear goals and activities, all within the limited volunteer time we have to contribute. Fact at this point is, the Foundation doesn’t have clear objectives, beyond the mission to support but not control the OSM project. To meet goals, we can take action, we can guide and steer, we can spend money. At the end of workshop, there should be a target that guides all our activities towards achievement. Some of the slides were beyond funny management clip art (a guy looking forlorn into the mirror, facing reality) but the point was important. “We are the Board! Shape the project!”

At this point, I thought it would be useful to look at some of the management lessons and differences from HOT. While we are by no means perfect, I do feel there’s good alignment between the organizational side of HOT and the community, largely the same community as OSM. Contrast to OSMF, HOT is very focused in what it does, with clear guidance and priorities and steering. We aren’t afraid of spending money when it’s necessary. We value marketing by the organization (though could be better). There are clear technical needs, and we pay for it. There’s a key attention to the consumption side of map data collection, seeking strategic partnerships with other organizations. We’ve been selective and directive with responsibility, and when necessary, have taken it away. We try to be as transparent as possible, publishing very detailed board minutes.

Goals


We took Oliver’s point and started strategic planning.

OSMF Board meeting traditionally use a simple technique to come to consensus on a topic, whether it’s the agenda of the meeting, or in the case of Seattle, the objectives and activities of the OSMF this year. We brainstorm all our choices on the subject, write them on the whiteboard. Each person gets some number of votes, say 5, and distributes them among the topics. If topics can be grouped together, their count is added together. There’s discussion about the meaning of terms, sometimes a lot of discussion. Iteration to insure that we all have a common understanding. At the end, there’s a list of priorities. I always squirm in this process, because somehow I don’t believe it can work, but inevitably does a pretty good job, and if we need to override, we’re not strict about the methodology.

In less than an hour, we had these goals for 2012.

The World’s Most Used Map OSM is clearly the world’s most used open map, and most open map, and the best map. We want as many people of possible contributing and using OSM, and to do that, the experience of using OSM needs to improve, and where you use OSM can improve.

More Than Just Streets Do you know everything OSM is capable of mapping? Does your neighbor? Does your mayor? OSM is relatively well known in some circles, but it’s full potentially is still opaque to many. We want everyone to know what OSM is about.

Cultivating Leadership of Mappers. Shared Goals Between the Community & OSMF Mapping is driven by mappers, with a clear goal (make the map!), and there’s every reason that with clear goals and empowered members, the OSMF can act strongly. We now have clear goals, and clear expectations of what the management team and working groups can do and achieve, without much prescription on how things happen. This all frees the Board to provide the direction, and the management team and working groups to make the operational decisions.

Easier Contribution for Non-Geeks We debated how this differed from the Most Used Map, and decided it was important enough focus to stand on its own. Usability is certainly related, but more broadly, there’s much to do to improve all kinds of involvement in OSM.

And Again

The bulk of our time was spent translating these goals into actions, and this really was the most difficult part. Some things were quick to decide, like the final switch over to ODbL, but others became very drawn out and very detailed, like the process for site redesign. We touched on every standing issue, and aligned clearly to the goals. PR, list moderation, license change, the management team, working group budgets, SOTM, PR, site redesign, the articles of association.

We all agreed that short term action was needed on almost everything, with mind to how things should play out in the longer term. This meant drawing the above diagram, a lot, to remind ourselves of the urgency. We set big, audacious goals for all parts of the Foundation, with clear deadlines.

With so much on the table, we decided to stay in the room until we had decided on everything, which ended up meaning staying hours late, til there was little sunshine outside (or metaphorically sunshine inside the room) and tension rising. At one point, I was so fed up, I almost walked out, really seeing that if we didn’t resolve the issue at the Board, it wouldn’t resolve in the Foundation and the project, the goals wouldn’t be met, and decline was inevitable. And for me personally, that would mean a slow turning away from a project ingrained in almost everything I do in the world. We had to push through.

And we did. Despite looking over the brink, we had resolve. I felt tense, but knew I’d be happy with what we accomplished.

And after it was all done, we had some beers. The next day we rode horses. Group hug.

Thanks to the 2012 Board. This is going to be the year.

And thanks for Oliver for the photos!

cross-posted from Brain Off

What’s new on OpenStreetMap.org?

Swan photo by Tony the Misfit is licensed CC-By

We spend a lot of time talking about the amazing map our users are producing, but perhaps not enough about the technology that enables it all. But it’s worth shouting about: from the reliable Ruby code that puts stuff into our super-efficient Postgres database setup, to the speedy hardcore cgimap code that sends it out to editors, to the wizardry of Mapnik that makes it all into beautiful maps… like the swan, there’s a lot of effort underneath the surface, but it all seems serene above water.

In fact, there’s a constant stream of changes aimed at making OpenStreetMap easier to use – big ones, yes, but also “little things that mean a lot”. So, for example, in the last month we’ve improved the “users near you” map (thanks to Martijn van Exel) and fixed potential security issues (thanks, as ever, to Tom Hughes). We’re also finishing up a move to Rails 3, which will help us make more user interface improvements, and keep the code clean. We’ll tell you more about these changes as they happen.

Have you noticed that osm.org adjusts to smaller screens with smaller tabs? It does now. Map CC-By-SA

Our Potlatch 2 editor has also had a whole bunch of improvements. It’s now much easier to draw shapes with holes (“multipolygons”), the GPS track handling is cleverer, and we have a clever feature where you can replace a node with a whole new one (select the old one and press O). We’ve incorporated a number of suggestions from usability research, and there’s still more to come.

If you’re a developer, we’d love to have your help with OpenStreetMap. There’s so much to do! You can find out about our codebase at http://wiki.openstreetmap.org/wiki/Rails, and join the rails-dev mailing list to bounce ideas off other developers. Or if you’d like to help with Potlatch 2, see http://wiki.openstreetmap.org/wiki/Potlatch and the potlatch-dev mailing list.

Weekly OSM Summary #29

October 17th, 2011 – October 31th, 2011

A summary of all the things happening in the OpenStreetMap (OSM) world.

  • During last weeks Google Doc Summit 2011 an OSM book for beginners has been created. You can buy it here and find a preview here.
  • The translations of the documentations for our well-known OSM Editor JOSM for Arabic, Greek, Hebrew, Icelandic and Turkish don’t fulfill the minimum standards. You can help to improve it. Otherwise they will be dropped in future releases. Other languages require updates as well!
  • The “ODbl coverage map” has been updated. The map shows the status of the OSM data related to the license change.
  • For Toulouse (France) several datasets have been announced under the ODbL. Read more in our wiki.
  • The official Maps for the “Giro d’Italia” are based on OSM data. OriginalTranslated.
  • Annette and Peter won the inaugural Torsten Brand Award for their OSM project: “Look and Listen Map”. Keep up the good work!
  • On October 23rd, 2011 an earthquake struck Turkey with a magnitude of 7.2. If you would like to help, you can find some information about which data sources you can use in our wiki.
  • A new website with general OSM stats is online. It will be updated daily.
  • Andy created a tool for Cyclestreets that imports and merges cycle way data of the Dft (Department for Transport) in Great Britain.
  • The “London Cycling Guide” is now using OSM data. You can find a book review here.
  • The “Heart of the Elephant and Castle Urban Forest Map” shows detailed positions of trees in London.
  • Martin created an animation showing the mapping progress in Rome (Italy).
  • You can add your ideas or suggestions for the Itomap to an OSM wiki page now. The First suggestions have been implemented already.
  • Thomas developed a webpage which displays the data of several Web 2.0 services such as Wikipedia, Twitter, Flickr, Panoramio, Gowalla … on an OSM map.
  • A really nice OSM map with 3D visualization for buildings in Poland.
  • The Public Transport Map (OpenPTMap) will now be updated on a daily basis.
  • A new PHP framework allows you to interact with the OSM API. Read a little bit more here.
  • Matthias created some pie charts, which visualize the usage of the OSM tileserver by different programs and services.
  • The Spanish administration has now an open data portal.
  • At the OpenDataCamp several projects used OSM data. You can find the results in their wiki.
  • The South African Census 2011 is using OSM for their “Verify Census Fieldworker” website (via Grant)

Did we miss something? You can contact us via weekly.osm@googlemail.com

Authors: Pascal & Dennis – (thx @ “Wochennotiz”)

Tile Usage Policy

Tile image by vidalia_11 is licensed CC-By-SA

We’ve had to block some uses of the OpenStreetMap Foundation tile servers. This article describes what is happening and why. This article also describes how you can adapt if you are affected.

We’re really proud of the increased popularity of OpenStreetMap. We’ve seen seven-plus years of project growth in every measurable area. As the project has grown we’ve learned and adapted in many ways. The use of our tile server has grown faster than every other aspect of the project. One way that we are adapting now, is by restricting how our map tiles may be used.

Slow sign by DaveCrosby is licensed CC-By-SA

You’ll still be able to use our tiles in creative and interesting ways but the volume of use will be limited. We need to limit access to our tile server to only those users who don’t overburden our resources.

Those users who make large demands on our tile server will be slowed down by our throttling mechanism. This throttling mechanism is rarely triggered by mappers.

Problematic applications may show this image instead of a map.

Those applications which make exceptional demands in aggregate from their users will be blocked. The tile usage policy is on the OSM wiki.

So what can you do about this? How can you get the wonderful OpenStreetMap tiles for your mobile device?

You’ll find more advice about potential tile source alternatives on the wiki.

Read on if you would like to know more about the history of the OpenStreetMap tile server.

OSM tile server background

We started creating rendered images of our map data as a way to encourage our data contributors. Mappers enjoy seeing the results of their surveys on the OpenStreetMap web site, and they can be inspired to map in their neighbourhood the things they see other mappers surveying in other places. Mappers loved the tile server when it first appeared. Potential users often looked at the map in 2006 and said, “Hey, why is there a huge blank spot where my town should be?” Some of those potential users became the long-time contributors that we all know and love.

As more contributors mapped more neighbourhoods, more blank spots started to fill in. More potential users became actual users, and OpenStreetMap tiles started to appear in more places. The tile server became even more popular when rapid updates were enabled. Rather than updating the map every week, parts of the map could update as contributors added data. If you remember the weekly updates you also remember that funny tingle you had the first time you mapped something and it appeared on the map immediately; it seemed like magic, didn’t it?

The OpenStreetMap Foundation has had a tile usage policy for some time. From September 2008 it has been explicitly stated that bulk downloading of tiles was discouraged. OpenStreetMap kept growing. More people came to understand the awesomeness of OSM tiles.

Also in 2008, the Ordnance Survey started serving map tiles to users through their OS Openspace program. In July of 2011, Ordnance Survey served their one billionth tile to a user.

OpenStreetMap serves a Billion tiles every eleven days.

So we know a thing or two about providing awesome maps to users. We do it all with the crowd-sourced data from our contributors around the world, the volunteered time of our sysadmins who keep our servers running, and the generous donations of servers and bandwidth and funds.

We’ve had to become more restrictive of the use of our tile server over time. We’ve limited how many tiles you can consume in a period of time. These restrictions only affected the most-demanding of tile consumers. The everyday mapper never ran into a problem getting tiles to add data to OSM. That allowed the growing number of users to continue to have access to OpenStreetMap tiles without our resources being monopolized by one or two bad actors.

More and more mobile applications started using OpenStreetMap tiles. Many of them included a bulk downloading method so that tiles could be saved on the device at home, rather than downloading tiles at a punitive data rate. That bulk-downloading has always been problematic for OpenStreetMap because a single user will consume hundreds of times the resources of an average user. There are so many applications using OSM tiles, with so many users making unreasonable demands on our resources that it is affecting the quality of service for the average user. And that’s not fair.

So we’ve started blocking the applications that are causing us the most trouble, in addition to blocking users with problematic specific behaviours. We regret it, in a way. After all, we map because we want people to be able to use our data. But our resources have to be used in a way that everybody can share. We can’t have a small number of people consuming all of our resources.

So that’s why some people have started to see the “prohibited” tiles on their maps. Overuse. Or mobile applications that are causing overuse by a group.